
Using TradingView Charts for Market Analysis
📈 Master TradingView charts for smarter market analysis! Learn about custom indicators, chart types, integration, and tips tailored for traders in Pakistan 🇵🇰.
Edited By
Sophia Greene
TradingView has gained immense popularity among traders worldwide, including many in Pakistan, due to its user-friendly platform and powerful analytical tools. For those looking to make informed decisions in the stock market, Forex, or cryptocurrency trading, mastering TradingView can dramatically improve market analysis and strategy development.
This guide takes you through practical steps to implement TradingView efficiently within your trading workflow. Whether you're a seasoned investor or just starting out, understanding TradingView’s features and how to customize them for your specific needs can be a game-changer.
We'll cover everything from setting up your account and navigating the key tools, to adapting the platform to Pakistani market conditions and overcoming common technical hiccups. The goal is to equip you with reliable, actionable knowledge that boosts your trading confidence and sharpens your analysis.
Tip: One often overlooked feature is TradingView’s ability to customize indicators; playing around with these tweakings can reveal market patterns you didn’t notice before.
Get ready to explore how this platform can fit snugly into your trading style and help you take better-informed decisions in Pakistan’s dynamic markets.
Starting any trading journey without a good platform is like trying to find your way in a fog without a compass. TradingView stands out because it offers a blend of user-friendly tools and deep market insights that even seasoned traders appreciate. This section aims to lay the foundation for understanding why TradingView deserves a place in your trading toolkit, especially for the diverse markets in Pakistan.
In market analysis, having timely and reliable data is half the battle won, and TradingView delivers on that front. It’s not just about flashy charts but how those charts can be tailored to your trading style and strategy. We'll talk about what makes TradingView tick, and why it consistently ranks high among individual traders and financial analysts alike.
TradingView is a web-based charting and social networking platform designed for traders and investors across various asset classes. Think of it as a Swiss Army knife for market analysis — it offers everything from live charts and historical price data to tools for technical analysis. Unlike traditional desktop software, it's accessible directly through a browser, which means you can check your setups wherever you go without being tied down. For Pakistan’s growing community of traders, who often juggle multiple markets, this flexibility is a game changer.
Using TradingView allows easy access to stocks, forex, cryptocurrencies, and even commodity prices all in one place. Moreover, it supports a wide range of chart types and timeframes, which means you can get both the big picture and very detailed views of the market — a critical advantage when timing entries or exits.
One of the key advantages of TradingView is how it democratizes market data and tools that once were only available to big institutions. For example, its cloud-based environment means your charts, alerts, and settings sync automatically, no matter the device. For analysts, it simplifies the process of sharing ideas or collaborating in real-time, eliminating the back-and-forth of screenshots and static reports.
Another point worth mentioning is how TradingView’s alert system keeps traders a step ahead. You can set alerts based on price, indicators, or custom conditions using Pine Script, TradingView’s proprietary scripting language. This feature is incredibly handy in volatile markets, like Pakistan’s equity scene, where missing a market move can cost you.
TradingView removes many traditional barriers by pairing powerful tools with easy access, making it a practical choice for both individual traders and professionals.
The heart of TradingView lies in its charting capabilities. Users get a smorgasbord of tools to customize charts exactly as needed—everything from basic line and candlestick charts to complex Renko or Heikin Ashi styles. Beyond aesthetics, indicators like Moving Averages, RSI, MACD, and Bollinger Bands are built-in and easy to apply.
Here’s a real-world example: consider a day trader focusing on the Pakistan Stock Exchange (PSX). Using Moving Averages combined with RSI helps identify not only trends but also overbought or oversold situations, making their decisions sharper and quicker. And when market conditions change rapidly, switching between different chart styles without hassle helps traders adapt on the fly.
TradingView also doubles as a social platform where traders exchange insights, ideas, and real-time updates. This feature is especially valuable for traders in Pakistan, where market transparency and information flow can be patchy. By following experienced analysts and local market experts on TradingView, users get access to curated, actionable content that’s relevant to their trading environment.
Community scripts and shared strategies provide a learning sandbox, encouraging not just passive consumption but active engagement. Such interactions can spark new trading ideas or reveal aspects of the market that might otherwise be overlooked.
In short, TradingView is not just a tool, but a marketplace of ideas where traders sharpen their edge by learning from each other — a practical boost for anyone aiming to improve performance in a competitive market.
Setting up your TradingView account correctly from the get-go is the backbone of a smooth market analysis experience. It’s not just about getting access; it’s about tailoring the platform so it fits how you work. Whether you're a seasoned trader eyeing Pakistan’s stock market or a financial analyst monitoring global indices, a well-configured account ensures faster decisions and fewer headaches down the road.
TradingView offers a variety of subscription plans and customization options, and understanding them helps you avoid paying for extras you might not need—or missing out on features that could be game changers for your setup. For example, someone tracking volatile assets like the Pakistan Stock Exchange's KSE-100 index every day will benefit from real-time data feeds, tight alert systems, and multiple chart layouts.
When deciding between TradingView's free and paid plans, the difference essentially boils down to the level of flexibility, data access, and tools you need. The free plan gives you a good starting point with access to basic charts and fewer indicators, but it comes with limitations like one active alert and ads on the interface.
If you’re casually following shares or forex pairs, the free plan might just cut it. But, for serious day traders or market analysts, those limits quickly become a bottleneck.
Free Plan: Limited to one chart per layout, one alert at a time, and fewer technical indicators. No access to extended market data or hedge funds trends.
Paid Plans: Start with Pro, climbing up to Pro+ and Premium. These remove ads, increase the number of charts per layout (up to 8), unlock multiple indicators per chart, and allow several alerts. Real-time data is often included at higher tier subscriptions — essential for Pakistani traders chasing quick market moves.
For example, a trader using the Pro+ plan could watch multiple Pakistani equities simultaneously, with alerts on price movements, volume spikes, and key indicator crosses — a must when markets can swing fast after regional news.
Here’s a quick rundown:
Pro: Ads removed, 2 charts per layout, 10 indicators, 10 alerts.
Pro+: Up to 4 charts per layout, 30 indicators, 30 alerts, enhanced customer support.
Premium: Up to 8 charts per layout, 50 indicators, 400 alerts, priority support, and multi-device syncing.
Many users find the Pro plan a strong middle ground, but if you want to set complex alerts or use several screens, moving to Pro+ or Premium pays off.
After picking the right plan, setting up your account properly includes two major steps: creating your profile and arranging your workspace to suit your analysis style.
Starting your account on TradingView is straightforward. Provide your email, choose a secure password, and verify it. You can also sign up with Google or Facebook for convenience. Important to note—use a professional email when possible, especially if you plan to integrate TradingView data into larger trading setups.
Keep in mind: when you sign up, you’ll be prompted to select a plan. It’s wise to start free to explore, then upgrade once you’re certain about the features you need.
Once logged in, customize your dashboard. This is where your trading styles and priorities come to life. You can:
Choose default chart types (candlestick, bar, line)
Set themes (dark mode is less straining for night trades)
Add indicators you regularly use, like RSI or Bollinger Bands
Arrange watchlists with local and international assets
For instance, a market analyst focused on Pakistan can set up a watchlist with PSX-listed equities, alongside Forex pairs like USD/PKR, enabling quick toggling between datasets.
Here, fine-tuning alert preferences is vital. Configure push notifications or email alerts so that you never miss critical market movements—even when away from your desk.
In short, a well-organized account helps keep distractions low and efficiency high. Customization specifics can vary, but prioritizing data visibility and alert setup is a win for anyone aiming to make sharp, timely trading decisions.
Setting up your TradingView account might sound basic, but every detail from subscription choice to dashboard layout plays into how effectively you analyze markets. Skip the hassle of scrambling later and invest a little time in the beginning—it literally pays off when you’re making split-second moves on Pakistan’s fast-moving stocks or global commodities.
Integrating TradingView into your trading setup is more than just linking a charting tool; it’s about weaving a powerful resource into your daily decision-making toolkit. When done right, it can offer real-time data, customizable visualizations, and easy sharing capabilities, all of which help traders, analysts, and investors build more confident strategies. For someone trading Pakistan’s markets, blending local insights with global data through TradingView can provide an edge that’s hard to replicate.
Accessing market data
TradingView's API allows you to tap directly into a wealth of market information, ranging from stocks and forex to commodities and cryptocurrencies. Instead of relying on delayed feeds, you get swift access that helps spot opportunities early. For instance, if you're tracking the Pakistan Stock Exchange, the API can pull updated prices and volumes, enabling your tools or custom applications to reflect current market conditions. This helps in making trades without the usual lag that sometimes sours decisions.
Customizing charts via API
The API isn't just about getting data; it lets you tailor how you see it. Suppose you want a chart that displays a custom mix of indicators like RSI and moving averages with specific colors and time frames. The TradingView API offers parameters to tweak your charts programmatically, so you don't have to manually set them up every time. This flexibility means your analysis tools work the way you want, saving both time and effort while providing clearer insights.
Types of widgets available
TradingView provides several widgets designed for embedding on websites to keep your audience or clients in the loop. Popular ones include the Symbol Overview widget, which shows current prices and percentage changes; the Mini Chart widget for compact trend viewing; and the Economic Calendar widget that highlights upcoming financial events. Each widget updates automatically, offering a dynamic, interactive experience without you needing to refresh data manually.
Step-by-step embedding process
Embedding TradingView widgets is straightforward and doesn’t require heavy coding skills:
Choose your widget: Head over to the TradingView widget page and pick the one that fits your site’s purpose.
Customize settings: Adjust parameters such as the financial instrument, color scheme, size, and language to match your branding.
Copy the generated code: TradingView will provide a snippet of code tailored to your selections.
Paste on your site: Insert this code snippet into the HTML of your webpage where you want the widget to appear.
Test the display: Check your site on different devices to ensure the widget looks good and functions properly.
Embedding these widgets can enhance your site's engagement by giving visitors instant access to relevant market data without leaving your page. This is especially useful for brokers or financial bloggers focusing on Pakistani markets or regional assets.
Proper integration of TradingView into your trading setup not only streamlines your work but makes market information more accessible and actionable. By using the API and embedding widgets effectively, you create a richer, more interactive environment both for yourself and your audience.
Customizing technical indicators and alerts is a game changer in making TradingView work smoothly with your personal trading style. It’s not just about setting up charts that look good—it’s about tailoring them to give you meaningful signals that fit your approach to market moves. In a busy market, especially with the unique trends from Pakistan Stock Exchange, having indicators and alerts finely tuned helps you avoid noise and catch real opportunities in time.
Many traders swear by certain key indicators for guiding their decisions, and TradingView offers a rich collection. For instance, the Relative Strength Index (RSI) helps spot overbought or oversold conditions, ideal for timing entry or exit points. Moving Averages—simple or exponential—smooth out price action to highlight trends. MACD is another crowd favorite, revealing momentum shifts with crossovers and divergence patterns.
The beauty of TradingView is how these tools come pre-built yet flexible enough for you to tweak. If you're watching KSE-100 or a specific sector index, adding Volume Weighted Average Price (VWAP) can provide insights on the true average price traded, which is invaluable for intraday setups.
No two traders are the same, so adjusting indicator settings is vital. Say, you usually trade on a shorter timeframe—changing the RSI period from the default 14 to 7 can make it more reactive to recent price swings. Or if you prefer spotting longer trends, a 50-day moving average works better than a 20-day.
You might also want to combine indicators. For example, if you use Bollinger Bands on a daily chart, tweaking the standard deviation parameter slightly can reduce false breakouts that are common in volatile markets like Pakistan’s. When you customize, always backtest to avoid overfitting. The aim is to get signals that resonate with your trading plan, not just chase every blip.
Alerts are your safety net—they notify you instantly when market conditions you're tracking unfold. TradingView supports several alert types: price-based (when an asset hits a certain level), indicator crossings (like MACD line crossing signal line), and condition-based alerts that combine multiple criteria.
For instance, you can set an alert to fire when the RSI crosses below 30, indicating a potential oversold condition, or when the price breaks above the upper Bollinger Band, signaling a breakout. These alert types make sure you're not glued to the screen but still don't miss crucial moments.
Once you’ve set an alert, how you get notified matters. TradingView lets you choose from pop-ups, emails, SMS, or even push notifications on your phone. This flexibility is gold, especially for traders in Pakistan balancing market hours with other commitments.
You can also fine-tune alert frequency—for example, setting it to trigger only once or every time the condition is met over a period. This avoids the typical 'alert spam' that tires traders out quickly. Setting silent hours or filtering alerts to only what really matters helps keep your focus sharp.
Smart customizing of indicators and alerts cuts through market noise and keeps you ahead with hands-free monitoring. It’s about working smarter, not harder.
By making thoughtful changes to these tools, you transform TradingView from a simple chart platform into your personal radar for smarter, quicker trading decisions.
Understanding Pine Script can be a game changer for anyone serious about customizing their TradingView experience. It’s the scripting language that lets you create your own indicators and trading strategies tailored exactly to your needs. Instead of relying solely on the preset tools, you have a chance to build something unique that fits your trading style or market preferences — especially useful when working with markets like Pakistan Stock Exchange, which might not always have ready-made tools.
Pine Script is designed to be simple yet powerful. It's created by TradingView itself to be an accessible way for traders to build custom studies and strategies without needing a degree in programming. You write it inside TradingView’s integrated editor, and it runs directly on your charts.
The language uses straightforward commands to access price data, technical indicators, and generate trading signals. Its syntax is quite friendly even if you’re new to coding, more like writing formulas than traditional programming. Through Pine Script, you’re able to automate certain analysis or flag conditions in the market that you find important, helping you spot opportunities quicker.
Starting out, you might want to create a basic moving average crossover indicator. The script will check if a fast moving average crosses over a slow moving average and then plot signals on the chart. Here's an example to get you going:
pine //@version=5 indicator("Simple MA Crossover", overlay=true) fastMA = ta.sma(close, 9) slowMA = ta.sma(close, 21) plot(fastMA, color=color.blue) plot(slowMA, color=color.red) crossUp = ta.crossover(fastMA, slowMA) crossDown = ta.crossunder(fastMA, slowMA) plotshape(crossUp, title="Buy Signal", location=location.belowbar, color=color.green, style=shape.labelup, text="BUY") plotshape(crossDown, title="Sell Signal", location=location.abovebar, color=color.red, style=shape.labeldown, text="SELL")
This script plots two moving averages and places buy/sell labels when they cross. It's a simple example, but it gives you a feel for how Pine Script logic translates into visual signals.

### Creating and Testing Your Own Scripts

#### Backtesting strategies

One of the biggest perks of Pine Script is the ability to backtest your trading ideas without leaving TradingView. Backtesting means simulating how your strategy would have performed on historical data. This can save you from costly mistakes in real markets.

For instance, if you create a script that generates buy/sell signals, TradingView lets you evaluate metrics like win rate, profit factor, and drawdown right on historical charts. It’s like having a time machine that shows if your idea holds water or if it needs tweaking before live deployment.

Keep in mind that while backtesting is helpful, real-world conditions like slippage and order execution delays aren’t always perfectly replicated.

#### Debugging and improving scripts

Writing scripts is rarely perfect on the first try. Errors can sneak in—from logical mistakes to syntax errors. The Pine Script editor helps by pointing out syntax issues and lets you use the "console" to print variable values for debugging.

A practical approach is to start simple, test each part of the code, and then build complexity step-by-step. For example, after coding your moving average crossover, you might add filters, like volume thresholds or time-based conditions, to improve reliability.

Requesting feedback from the TradingView community or reading published scripts can also spark ideas and solutions to common bugs.

> **Tip:** Use comments (`//`) generously within your code to explain what each part does. This is helpful if you come back to it after some time or share it with peers.

Exploring Pine Script this way enhances your Market Analysis on TradingView, letting you move beyond just charts to crafting custom tools and strategies that suit your unique approach. It’s well worth investing the time to learn — especially if you want your trading edge to be more than just guesswork.

## Common Challenges in TradingView Implementation

Using TradingView effectively isn’t always a walk in the park, especially when real-world complications start to creep in. This section shines a light on typical hurdles traders face when implementing TradingView and offers solid advice to keep things running smoothly. Understanding these common issues helps traders avoid unnecessary headaches and keeps their analysis as sharp as possible.

### Troubleshooting Data Accuracy and Delays

#### Handling discrepancies in market data

Data accuracy is the backbone of reliable trading decisions. Sometimes, prices or volumes on TradingView don’t quite match what brokers or other platforms show. These discrepancies often arise because of differences in data sources or delays in updates. For instance, if TradingView pulls data from a third-party feed that updates slower than your brokerage’s direct feed, the prices you see may lag or differ slightly. It's important to cross-check critical trade setups against your broker's chart or other reliable sources before pulling the trigger.

A practical tip is to select data feeds within TradingView that match your trading instruments’ main exchanges. For Pakistan-based traders, ensuring integration with the Pakistan Stock Exchange data feed can minimize mismatches. Additionally, keeping an eye on multiple sources can alert you when something’s off.

#### Ways to minimize latency issues

Latency — the delay between a market event and when you see it — can cost traders dearly, especially those making rapid trades. To cut down on lags, use wired internet connections whenever possible; Wi-Fi can introduce unpredictable delays. Also, tweaking your TradingView settings to reduce chart complexity (like lowering the number of indicator scripts running simultaneously) helps keep everything snappy.

Another useful tactic is to leverage TradingView's real-time data subscriptions for your markets of interest, which reduce the delay compared to free delayed data. For day traders focusing on Pakistan Stock Exchange equities, subscribing to premium data streams from TradingView or local data providers can make a significant difference.

### Overcoming User Interface Complexities

#### Simplifying chart layouts

Charts can get messy fast, especially when layering multiple indicators, overlays, and drawings. Over-cluttered charts slow down decision-making and increase the risk of missing key signals. The trick here is to start with essential indicators that align tightly with your trading strategy and build up gradually.

For example, if you rely on moving averages and RSI, stick to those initially instead of adding a dozen fancy oscillators. Group your drawings neatly and use color-coding to differentiate them without chaos. Remember, clarity beats flashiness — a clean, simple chart helps your eyes and brain process info faster.

#### Efficient use of watchlists and dashboards

Watchlists are like traders’ lifelines, but they tend to become cluttered with stocks or assets that aren’t actively traded or analyzed. To keep things tidy, regularly prune your watchlist to include only active picks or those you're currently monitoring carefully. Using TradingView’s tags and notes feature helps categorize assets, making it easier to jump between sectors or strategies.

Dashboards can get overwhelming too. Customize dashboards by tagging widgets based on your daily workflow. Say you focus on forex pairs in the morning and Pakistani equities in the afternoon — setting up separate dashboards for these can save you from unnecessary info overload.

> Keeping TradingView organized and running smoothly is as important as the strategy itself. Chances are, your tools will work best when they’re less cluttered and more tailored to your trading habits.


## Tips for Maximizing TradingView's Potential in Pakistan

When using TradingView in Pakistan, it’s not just about knowing the platform but understanding how to tailor it to the local market’s quirks and opportunities. The right approach means blending global tools with local insights, which can make a real difference in trading outcomes. This involves tapping into Pakistan-specific data feeds and leaning on community features that bring in regional expertise.

### Leveraging Local Market Data

#### Integrating Pakistan Stock Exchange data feeds

Connecting TradingView with live feeds from the Pakistan Stock Exchange (PSX) is essential for real-time analysis. These feeds ensure that charts and market indicators reflect the latest trading activity, price movements, and volumes specific to Pakistan’s market. Without fresh data, you’re essentially flying blind. Practical steps include subscribing to PSX data packages or using brokerages that support TradingView integration with local stocks. This setup allows traders to monitor active stocks such as OGDC or Habib Bank, making it easier to spot momentum or reversal patterns without switching platforms.

#### Tracking region-specific assets

Pakistan’s market isn’t limited to just equities. There are commodities like wheat and sugar, as well as currency pairs like PKR/USD that traders keep an eye on. TradingView users can customize watchlists to include these region-specific assets or even government bonds, which play a significant role in local investment strategies. By doing so, traders stay in tune with economic shifts directly affecting the region. For instance, watching the PKR against USD or AED can help in understanding inflation impacts on import-heavy industries.

### Community and Collaborative Features

#### Accessing local trader groups

One of TradingView’s strengths is its social network of traders. In Pakistan, joining local trader groups can be a game changer. These groups often share insights on market sentiments, upcoming IPOs, or government policies impacting the market. To join, search for Pakistani trading communities on TradingView’s public chats or forums and participate actively. This interaction not only sharpens one’s market perspective but also provides timely tips that may not be evident just from chart analysis.

#### Sharing and following trading ideas

Sharing trading ideas with peers and following experienced traders on TradingView can boost learning and strategy refinement. Pakistani traders can post their chart analyses on PSX stocks or forex pairs, opening the door for community feedback. Likewise, bookmarking ideas from well-followed local traders provides a steady stream of new setups or risk management approaches tailored to the Pakistani market. Consistent engagement here turns TradingView into not just a tool, but a collaborative trading companion.

> Remember, trading success often hinges on context. Tools like TradingView maximize their value when adapted thoughtfully to fit your trading environment—local market data and a community of peers will give you that edge.

By focusing on these Pakistan-specific strategies, traders can get much more from TradingView, making it an indispensable part of their daily trading routines.

## Final Note: Making TradingView Work for You

Wrapping up, the goal here is to help you turn TradingView from just another tool into a real asset in your trading arsenal. After digging through the platform’s setup, features, and customization options, it’s clear TradingView can be tailored exactly to how you want to work, rather than the other way around. For example, a trader focused on the Pakistan Stock Exchange can integrate local data feeds and follow community ideas unique to that region, which makes analysis way more relevant and timely.

TradingView’s strength lies not just in charts but in how it connects data, indicators, alerts, and community insights all in one spot. To make the most of it, remembering the core setup and customization steps ensures you’re not lost in its vast options. Plus, knowing how to tweak alerts for your specific trading schedule means you can act when it matters — not when you’re glued to the screen.

### Recap of Implementation Essentials

#### Summary of setup and customization

Setting up TradingView is pretty straightforward but demands attention to detail. From picking the right subscription plan based on what markets you trade, to setting up your personal watchlists and chart layouts, every step is about creating a workflow that suits you. Remember how customizing indicators to suit your strategy — say tweaking RSI periods or Bollinger Bands settings — can make a big difference in spotting opportunities early. Also, alerts synced to your phone or email mean you're plugged in even on the go.

#### Key points to remember

- Start with clear goals: What markets, what style of trading? This guides your entire setup.
- Don’t overload charts with too many indicators; simplicity often wins.
- Make use of TradingView’s community ideas but always double-check with your own analysis.
- Backtest your strategies using Pine Script before risking real money.
- Keep alert settings practical — too many notifications can numb your response time.

These points keep your TradingView experience sharp and tailored, avoiding common pitfalls like information overload or misaligned tools.

### Next Steps for Continued Learning

#### Resources for mastering TradingView

Learning TradingView isn’t a one-and-done deal. Platforms like YouTube channels named "Trader Tech" and "TheChartGuys" often offer practical TradingView tutorials suited for all levels. Also, TradingView’s own Help Center and educational webinars are pretty hands-on, showing how to navigate tools or write scripts for customized strategies. For users in Pakistan, joining local trader groups on social media or forums can exchange insights specific to regional trends and how best to use TradingView there.

#### Staying updated with platform changes

TradingView keeps adding new features and improving performance regularly. To avoid getting blindsided, it's wise to keep an eye on their official blog and update notifications within the app. Participating in forums or following TradingView on social media also helps you catch tips on new tools or bug fixes before they become mainstream knowledge. This way, you’re always ahead of curve, keeping your setup current with changes.

> Staying proactive about learning and tweaking your TradingView setup can save you from costly mistakes and make your market analysis more accurate and faster.

With these final steps, you’re well set to make TradingView not just a charting platform but a practical partner in your trading journey.📈 Master TradingView charts for smarter market analysis! Learn about custom indicators, chart types, integration, and tips tailored for traders in Pakistan 🇵🇰.
📈 Discover how TradingView charts help traders in Pakistan analyze markets with real-time data, technical tools, and a supportive social community. 🇵🇰
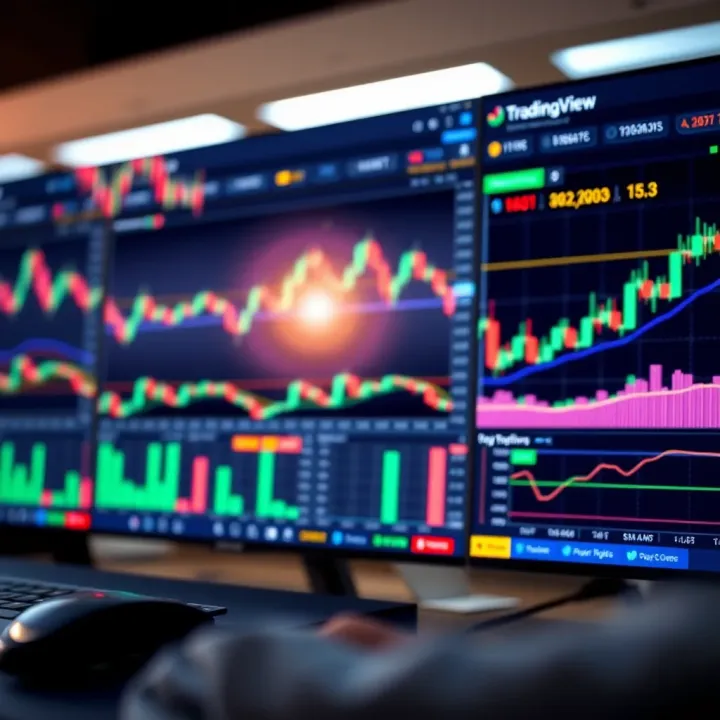
📊 Learn how to use TradingView for smarter binary options trading in Pakistan. Explore charts, broker integration, and expert tips to boost your trades!
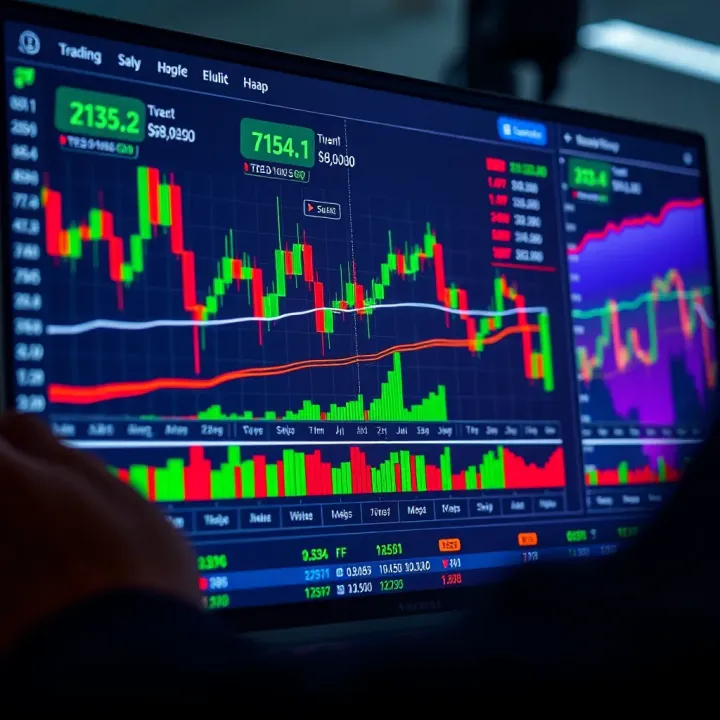
Explore TradingView.com 📈 with our detailed guide for Pakistani traders 🇵🇰. Learn chart tools, market data, community features & tips for local trading.
Based on 8 reviews