
Practical Guide to Using TradingView for Market Analysis
📊 Learn how to set up and customize TradingView for smarter market analysis in Pakistan. Tackle common issues and boost your trading strategy today!
Edited By
Grace Mitchell
Deriv TradingView offers Pakistani traders a powerful platform for detailed market analysis. It combines real-time data with advanced charting tools, making it easier to spot trends and make informed decisions. Whether you’re trading forex, commodities, or indices, the platform provides flexibility and accuracy essential for navigating volatile markets.
At its core, TradingView within Deriv provides interactive charts that support multiple timeframes, from minutes to months. This flexibility helps traders see both short-term price moves and long-term trends. For example, a day trader can monitor 5-minute charts while a swing trader focuses on daily or weekly views.
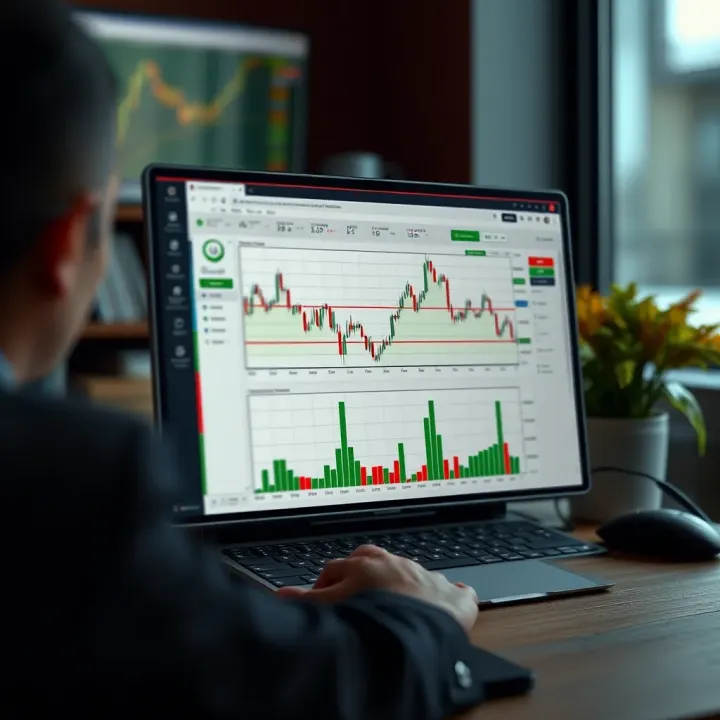
The platform includes hundreds of technical indicators like Moving Averages, RSI (Relative Strength Index), and Bollinger Bands, which help analyse momentum, volatility, and potential reversal points. Plus, its user-friendly interface lets you add, remove, or customise indicators swiftly, ensuring your setup fits your strategy.
A standout feature is the ability to draw trend lines, support/resistance zones, and Fibonacci retracements directly on charts. This visual aid is especially useful in Pakistan’s dynamic markets, where sudden price swings during key economic announcements are common. Traders can prepare by marking crucial levels and setting alerts.
Beyond charting, Deriv TradingView supports multi-asset tracking, so it’s possible to watch forex pairs, metals like gold, and even cryptocurrency charts all on one screen. This consolidated view helps compare market performance quickly—for instance, checking how PKR exchange rates behave alongside oil prices.
Using Deriv TradingView’s tools can reduce guesswork. Visual signals from indicators combined with real-time data empower traders to enter or exit markets with greater confidence.
To get started, Pakistani traders should explore preset layouts and use drawing tools for practice. Setting alerts on price levels can prevent missed opportunities during working hours or outside market hours due to loadshedding or connectivity issues.
In summary, Deriv TradingView equips you with the charts and indicators needed to analyse markets efficiently. Its adaptability to different timeframes and assets makes it a go-to choice for serious traders keen on improving their market reading skills.
Understanding the Deriv TradingView platform is essential for any trader aiming to make better market decisions. It combines the user-friendly interface of Deriv with the powerful charting tools of TradingView, giving traders in Pakistan and beyond an effective way to analyse price movements and execute trades.
Deriv is an online trading platform offering access to various financial markets including forex, commodities, indices, and synthetic indices. It caters to a wide spectrum of traders with its easy-to-use features and diverse product offerings. For Pakistani traders, Deriv represents an accessible gateway to global markets, supported with options like localised payment methods such as JazzCash and Easypaisa.
The platform integrates TradingView charts directly into its interface, combining TradingView’s renowned charting capabilities with Deriv’s trading environment. This means traders can analyse detailed, interactive charts without switching between platforms. For instance, you can apply multiple indicators and draw trend lines on TradingView charts, then place trades immediately within Deriv, streamlining the trading process.
TradingView charts offer advanced tools that help traders spot patterns and trends with ease. They include multiple chart types like candlestick, line, and bar charts, plus various time intervals suitable for day trading or long-term positions. Pakistani traders benefit from these options when analysing volatile assets like PKR/USD or oil prices. The ability to customise charts enhances clarity, making it easier to focus on relevant data without distractions.
Having real-time market data is pivotal for timely decisions, especially in fast-moving markets. Deriv TradingView provides live price feeds and updates, reducing the risk of delays that can affect trade outcomes. For example, during announcement of SBP interest rate decisions, accessing live charts helps traders react instantly. This immediacy improves confidence in entry and exit points, essential for managing risks effectively.
Combining Deriv's trading platform with TradingView's powerful charting tools gives traders in Pakistan a practical edge, enabling smart and confident market choices with up-to-date information.
Understanding these basics sets the stage for leveraging the full potential of Deriv TradingView, which we explore further in the next sections.
Understanding the core features of Deriv TradingView charts is essential for traders aiming to analyse markets more effectively. These charts provide versatile tools that adapt to various trading techniques, helping you spot trends and make timely decisions. The platform combines intuitive chart types with adjustable time frames and customisation, allowing traders to tailor views according to their specific needs.
Deriv TradingView offers several chart types including candlestick, line, and bar charts. Candlestick charts are especially popular among traders because they show the open, high, low, and close prices, offering a detailed snapshot of price action within a chosen time frame. For example, a Pakistani trader following the PSX can use candlestick charts to observe daily price fluctuations of key stocks such as OGDC or HBL. Line charts, on the other hand, simplify market data by connecting closing prices, making them useful for identifying overall trends without extra noise. Bar charts resemble candlesticks but display price ranges with vertical lines, useful for short-term traders focusing on price volatility.

Tick charts show price movements based on a specific number of trades instead of time. This means a new bar appears after a set number of transactions, which can be ideal for fast-paced trading like forex or commodities. Tick charts help traders pinpoint momentum shifts and market reactions more precisely, often capturing subtle market moves invisible on time-based charts. They serve well in volatile markets, such as during major economic announcements affecting the PKR exchange rate.
Selecting appropriate time intervals is crucial for aligning charts with your trading style. Short-term traders or scalpers might prefer 1-minute or 5-minute charts for quick entries and exits. Swing traders usually lean towards 4-hour or daily charts to capture medium-term price movements. Position traders and investors typically focus on weekly and monthly charts to track larger trends. Deriv TradingView allows you to switch seamlessly between these time frames, ensuring your analysis stays relevant to your strategy.
Customising chart appearance enhances usability and reduces eye strain during long sessions. Deriv TradingView lets you adjust colours, grid lines, and background themes to suit personal preferences or ambient lighting conditions. For instance, switching to a dark mode can ease eye fatigue during late-night trading common in Pakistani markets due to time zone differences. You can also add or remove technical overlays, like volume bars or moving averages, keeping your charts clean and focused on what matters most.
Personalising both the chart type and time frame enhances clarity, helping traders make more informed decisions without distraction or confusion.
Mastering these core features positions you better to read market signals and react swiftly, ultimately improving trading outcomes on Deriv TradingView.
Technical indicators help traders make sense of price movements and market trends. On Deriv TradingView, these tools offer valuable insights by analysing price data, volume, and momentum. For traders in Pakistan, combining these indicators with local market understanding sharpens decision-making and minimises guesswork.
Moving averages smooth out price data to reveal trends over time. The Simple Moving Average (SMA) calculates the average price over a specific period, making it easy to identify the general direction of an asset’s movement. The Exponential Moving Average (EMA), by contrast, gives more weight to recent prices, reacting faster to recent market changes.
For example, when trading the Pakistan Stock Exchange (PSX), a trader might use a 50-day SMA to spot a longer-term trend, while an EMA of 12 days signals short-term momentum. If the EMA crosses above the SMA, it may indicate a bullish trend, prompting a buy decision.
RSI measures how quickly prices have changed, highlighting overbought or oversold conditions. It’s expressed as a number between 0 and 100. Typically, an RSI above 70 suggests the asset might be overbought and due for a pullback, while below 30 implies oversold conditions potentially leading to a rebound.
Pakistani traders often use RSI during volatile periods, like sudden movements in currency pairs such as USD/PKR. If RSI hits 80, caution is advised as the market might correct itself soon.
MACD tracks the relationship between two EMAs to indicate momentum changes and trend reversals. When the MACD line crosses above the signal line, it often signals upward momentum; crossing below suggests a downtrend.
For instance, a trader monitoring commodity prices like oil might use MACD to confirm buy or sell signals, especially when combined with volume data on Deriv TradingView’s platform.
Using more than one indicator helps confirm market signals and reduces false positives. For example, pairing RSI with moving averages can help verify whether a trend is strong or overextended. If moving averages show an upward trend but RSI indicates overbought, a trader might wait before entering.
Such a combination is crucial when trading volatile instruments like forex pairs or indices to avoid premature decisions that could lead to losses.
While it’s tempting to apply every indicator available, too many tools can create confusion and conflicting signals. Traders should focus on a few complementary indicators that suit their style and the asset they trade.
For example, relying on SMA, RSI, and MACD alone provides a balanced view without cluttering the chart. On Deriv TradingView, keeping the workspace clean ensures faster analysis, especially when internet speed and computer performance may fluctuate in Pakistan.
A clear, focused approach to technical indicators enhances your trading accuracy and keeps decisions sharp, particularly in fast-moving markets.
By mastering these indicators and using them wisely, traders can better time entries and exits, improving overall market analysis on Deriv TradingView.
Deriv TradingView offers a platform rich with tools that support various trading strategies, making it valuable for traders aiming to make well-informed decisions. These strategies cater to different market conditions, allowing users to adapt their approach based on trend strength or lack thereof. The platform’s charting capabilities and indicators make it easy to identify key signals, enhancing both entry and exit timing.
Moving averages are among the simplest yet most effective tools available on Deriv TradingView for spotting market trends. By smoothing out price fluctuations, moving averages help traders identify the overall direction—uptrend, downtrend, or sideways. For example, a common approach is to watch the 50-period Exponential Moving Average (EMA) crossing above the 200-period EMA, signalling a bullish trend. Pakistani traders can use this method on currency pairs like USD/PKR or indices such as KSE-100 to confirm momentum before entering trades.
This technique works well for those who prefer to ride the trend rather than guess reversals. Since Deriv TradingView updates charts in real-time, you can promptly react when moving averages cross, minimizing emotional decision-making and focusing on clear trend signals.
Breakouts occur when price moves beyond established support or resistance levels, often leading to strong momentum in that direction. Deriv TradingView charts make spotting these levels easier by visually marking key horizontal zones or trend channels. When the price breaks above resistance, traders can enter long positions anticipating further gains; similarly, breakdowns of support can signal short opportunities.
Within the platform, TradingView signals such as volume spikes and candlestick patterns (e.g., bullish engulfing) complement breakout strategies. For instance, if Karachi Stock Exchange index breaks its recent high with increased volume, it could indicate bullish strength, encouraging traders to join the move. Using these signals together improves timing, boosting the chances of a successful trade.
In markets where price moves sideways without a clear trend, support and resistance levels become critical. Deriv TradingView enables precise drawing and identification of these zones, helping traders buy near support and sell near resistance. For example, a trader observing NIFTY futures oscillating between Rs 15,000 and Rs 15,200 may decide to initiate buy orders near the lower boundary and sell near the upper ceiling.
This approach suits markets seen in Pakistani equity or commodity trading during consolidation periods. The clarity provided by TradingView’s visual tools helps prevent premature entries, supporting more confident and calculated trades.
Oscillators like the Relative Strength Index (RSI) and Stochastic indicator are effective in range trading by signalling overbought or oversold market conditions. When these indicators show that an asset is oversold near support, it suggests a buying opportunity; when overbought near resistance, it warns to exit or short.
Deriv TradingView lets users monitor these oscillators in real-time. A trader watching the RSI dip below 30 on a Pakistan Oil Futures chart, close to a strong support level, might consider this a good moment to buy. Conversely, an RSI above 70 near resistance can prompt profit-taking. Using these indicators in tandem with support and resistance reduces guesswork, improving decision reliability.
Combining trend following and range trading strategies with Deriv TradingView’s tools gives Pakistani traders flexibility to respond to varying market dynamics with confidence and precision, making it an essential part of successful market analysis.
Pakistani traders face unique challenges such as fluctuating market hours, occasional internet instability, and distinct asset preferences. Practical tips tailored to these realities help optimise the use of Deriv TradingView, improving both analysis quality and trading outcomes. By adjusting settings thoughtfully and managing technical constraints effectively, traders can navigate the platform to better suit local market conditions and enhance decision-making.
Adjusting time zones and market hours is essential for accurate market analysis on Deriv TradingView. Since Pakistan Standard Time (PKT) is five hours ahead of GMT, aligning the chart timelines with PKT ensures you view data in your local context. For instance, if analysing global indices or forex pairs traded in different time zones, adjusting chart sessions to reflect Pakistani trading hours helps avoid confusion about opening or closing prices. This is particularly useful when markets like the New York Stock Exchange or London Stock Exchange influence asset prices.
Selecting asset-specific indicators improves analysis relevance for Pakistani traders. Different asset classes respond better to certain technical tools; for example, forex pairs like USD/PKR often benefit from moving averages combined with momentum indicators like RSI to spot entry points amid volatility. Meanwhile, indices such as KSE-100 might require trend-based indicators focusing on price action due to local market trends. Customising indicator selection for specific assets helps you avoid information overload and highlights key market signals.
Managing internet connectivity and platform performance is critical given Pakistan’s network fluctuations and occasional loadshedding. Traders should prefer wired broadband connections or 4G/5G mobile data with steady speed to minimise interruptions on Deriv TradingView. Also, clearing cache and updating browser versions regularly ensures the charting platform runs smoothly without lag. For example, during volatile market hours, a delay of even seconds could affect timely decisions, so maintaining optimal connectivity reduces such risks.
Using mobile vs desktop versions has practical implications for Pakistani traders too. The desktop version offers a more comprehensive interface, suitable for detailed charting and multi-indicator analysis, preferred by traders working in offices or at home. On the other hand, the mobile app or browser version allows quick checks on the go, which is handy when commute or site visits interrupt routine trading. However, mobile devices may sometimes suffer from slower loading or reduced screen size, which can limit detailed technical study. Balancing usage between devices based on convenience and trading needs works best.
For Pakistani traders, adapting Deriv TradingView’s tools and platform settings to local conditions—like PKT alignment, asset focus, and network stability—is not just helpful, but necessary for reliable market analysis and timely trades.
Presenting smart practical approaches rooted in Pakistan’s distinct trading environment improves proficiency and boosts confidence among local traders using Deriv TradingView.
📊 Learn how to set up and customize TradingView for smarter market analysis in Pakistan. Tackle common issues and boost your trading strategy today!
📈 Master TradingView charts for smarter market analysis! Learn about custom indicators, chart types, integration, and tips tailored for traders in Pakistan 🇵🇰.
📈 Learn how to connect TradingView with Deriv for smarter trading in Pakistan. Tips, setup guides, and security pointers to boost your strategy effectively.

📈 Learn how to integrate and customize TradingView charts on Deriv. A step-by-step guide for Pakistani traders to enhance decision-making and overcome setup hurdles.
Based on 15 reviews