

Understanding Deriv Broker: Key Insights for Traders
Explore Deriv Broker's platform operations, account types, and trading instruments. Learn security, regulations, and tips especially for Pakistani traders 🇵🇰📈
Edited By
Liam Gallagher
Chart patterns are essential tools for anyone active in financial markets, especially in Pakistan's dynamic trading scene. They provide visual clues on price formations, allowing traders and investors to predict possible market moves by studying past price data.
Recognising chart patterns helps in spotting potential trend reversals, continuation signals, and breakout points. For example, a head and shoulders pattern might indicate an upcoming bearish trend, while a cup and handle can signal bullish continuation. Understanding these shapes can save a trader from costly mistakes and optimise entry and exit points.

The practical value of chart patterns extends beyond mere identification. Successful traders combine pattern reading with volume data and other technical indicators to confirm signals. For instance, a breakout from a triangle pattern with rising volume increases the odds of a sustained move.
Learning chart patterns is like reading a map to navigate price action. Once you get the hang of it, trading becomes less about guesswork and more about informed decision-making.
Traders based in Pakistan often face challenges such as unpredictable volatility and limited access to quality educational resources. That's where well-compiled PDF guides come in handy. These resources consolidate pattern charts, definitions, real examples from PSX or forex markets, and trading tips in one place, making learning efficient and handy.
To maximise the benefit from these PDFs:
Start with basic patterns like double tops/bottoms, flags, and wedges.
Study annotated examples from local markets where available.
Combine pattern knowledge with risk management strategies.
Overall, a solid grasp of chart patterns and access to dependable PDF materials can significantly improve your market reading and trading confidence. As Pakistan’s financial markets continue evolving, sharpening these technical skills remains a smart move for all traders and investors.
Chart patterns provide visible clues about the battle between buyers and sellers in financial markets. They reflect collective trader psychology and help predict possible price movements. Understanding these patterns lets traders anticipate trends rather than react to them blindly.
Chart patterns are shapes or formations on price charts created by historical price data. They represent shifts in market sentiment that often lead to trend continuation or reversal. For example, the "head and shoulders" pattern signals a weakening uptrend, often followed by a downtrend, while a "triangle" pattern may indicate a pause before prices break higher or lower. These patterns help decode market behaviour beyond raw numbers.
Spotting chart patterns gives traders a practical edge. By recognising specific formations early, traders can set strategic entry and exit points, improving their risk-reward balance. For instance, noticing a "double bottom" in a stock traded on the Pakistan Stock Exchange (PSX) might hint the price is ready to rally, guiding decisions to buy on dips rather than catching falling knives. Besides timing, patterns help manage risks by signalling when to tighten stop-loss orders.
Traders who rely solely on technical tools without pattern recognition miss out on context that improves their decision-making.
Pakistan’s markets have unique volatility drivers—political developments, policy shifts by the State Bank of Pakistan (SBP), or sudden economic news frequently impact prices. Chart patterns adapt well to this environment, helping traders understand price swings influenced by local events. For example, during Ramazan or election periods, markets often show increased trend reversals; recognising patterns like "flags" or "pennants" can help traders anticipate these short-term fluctuations.
Moreover, with the rise of digital trading platforms and resources available in PDF formats in Urdu and English, Pakistani traders can easily access pattern guides tailored to local market nuances. Active use of chart patterns alongside fundamental analysis deepens insights and strengthens trading strategies in Pakistan’s dynamic financial landscape.
Understanding common chart patterns helps traders spot where the market might head next. These patterns form visually on price charts and indicate potential trend shifts or pauses. For Pakistani traders, this knowledge can guide better entry and exit decisions in markets such as the Pakistan Stock Exchange (PSX) and forex trading. Recognising these patterns reduces guesswork and adds a layer of analysis grounded in price behaviour, not just news or speculation.
The Head and Shoulders pattern signals a trend reversal from bullish to bearish or vice versa. It consists of three peaks: a higher middle peak (the head) flanked by two lower peaks (the shoulders). When the price breaks below the neckline—the support line connecting the two troughs—it often means a downward trend will follow. For traders in Pakistan, spotting this pattern on PSX charts can help exit gaining stocks before a reversal erodes profits.
Double Tops and Double Bottoms are classic reversal indicators too. A Double Top shows two peaks at roughly the same level, suggesting resistance is strong and a fall is likely. Conversely, a Double Bottom forms two lows at similar price points, hinting that support has established and prices might rise. These patterns are easier to identify and can provide confidence when assessing whether to hold or sell a share amid volatile market conditions.
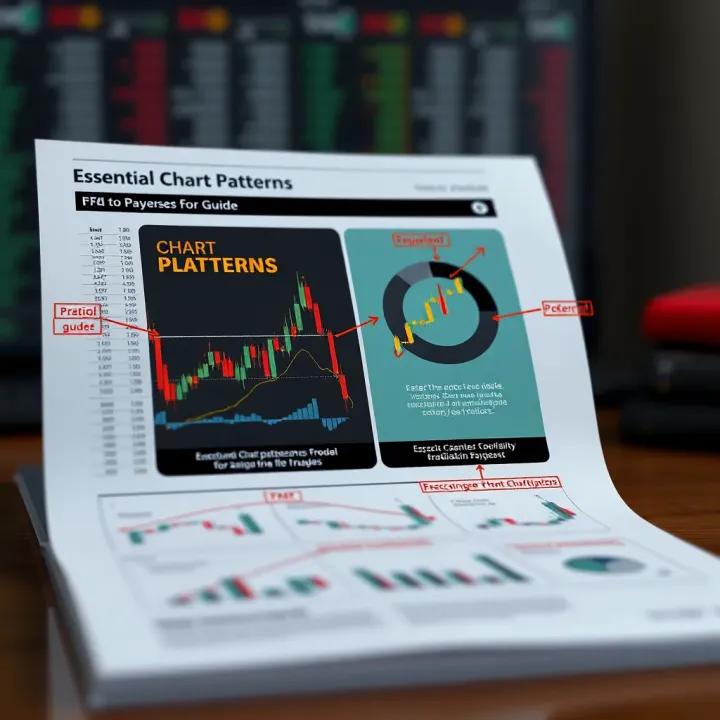
Triple Tops and Bottoms are similar but offer stronger confirmation, since the price tests the same level three times. For example, a Triple Top with three failed attempts to break a resistance level may indicate a solid bearish turn soon. It takes patience to validate these patterns, but when confirmed, they are useful for timing trades in markets like forex or commodities involving Pakistani rupees.
Triangle patterns show a pause in current trends, usually followed by continuation. Symmetrical triangles hint at indecision—buyers and sellers are almost balanced. Ascending triangles suggest bullish pressure as highs stay level while lows rise, signalling possible upward breakout. Descending triangles show opposite behaviour, with bearish pressure likely. Using these patterns helps traders decide whether to hold on or take profits during pauses.
Flags and Pennants appear as small consolidations after strong price moves. Flags look like rectangles slanting against the trend, and pennants resemble small symmetrical triangles. These usually signal a brief break before the prevailing trend resumes. For intraday traders or swing traders on PSX, these provide quick signals to catch a trend’s continuation without getting caught in minor reversals.
A Rectangle forms when price moves sideways between support and resistance levels. This suggests equilibrium as buyers and sellers pause, awaiting fresh triggers. Breaking above or below this range often leads to strong moves, so rectangles offer clear points to set stop-loss or take-profit orders.
The Cup and Handle pattern looks like a bowl followed by a slight dip (handle). It generally signals continuation of a bullish trend after consolidation. This is useful on longer-term charts of Pakistani equities where a steady recovery is underway and a breakout from the handle signals fresh buying opportunities.
Rounding Bottoms form a smooth U-shape, reflecting a gradual shift from sellers to buyers. It represents long-term accumulation and reversal from a downtrend into an uptrend. Traders focused on medium-term trends in markets like PSX might get early clues of recovery using this pattern.
Wedges are sloping patterns that can predict reversals or continuations based on their direction. Rising wedges typically warn of a bearish reversal despite price increases, whereas falling wedges hint at bullish reversals amid falling prices. Paying attention to volume alongside the wedge helps confirm the move, which is important for careful risk management.
Recognising these common chart patterns sharpens your market reading skills and helps make informed trading decisions. Practise identifying them on historical charts with available PDF guides to build confidence before applying in the live market.
Using PDF guides to learn chart patterns offers a practical way to enhance your trading skills, especially if you prefer structured, offline study. Such resources can serve as handy references during market analysis and help build a strong foundation in technical analysis.
Not all PDFs on chart patterns are equally trustworthy or up to date. Look for resources authored by reputed traders or published by recognised financial educational platforms. For example, PDFs from established institutions or published Pakistani brokerage firms often provide content tailored for local market nuances. Avoid outdated PDFs; market behaviour and terminology evolve, so resources from the last five years usually offer better insight. Also, ensure the PDF includes clear illustrations and real-world examples, which help deepen understanding beyond theory.
To get the most from chart pattern PDFs, treat them like a workbook rather than just reading material. Mark important sections, summarise pattern characteristics in your own words, and practise identifying patterns on actual charts side by side. For instance, after studying the 'Head and Shoulders' pattern, scan the Pakistan Stock Exchange (PSX) daily charts for similar formations. Repetition builds confidence. Integrate short quizzes or flashcards into your study routine to recall pattern traits quickly. Over time, this active engagement will sharpen your pattern recognition skills.
Linking the theoretical knowledge from PDFs with your chosen trading platform can accelerate your learning curve. Many platforms, such as MetaTrader or local broker apps like MTrading Pakistan, allow you to draw patterns directly on live charts. After reading a PDF section, open your trading platform, locate the discussed pattern, and practise marking it. This habit bridges theory and practice effectively. You can also keep PDFs accessible on your mobile or tablet for quick reference while analysing market moves.
Consistent use of quality PDF guides alongside hands-on chart practice transforms abstract concepts into actionable trading strategies. This approach reduces guesswork and improves timely, confident decision-making.
By carefully selecting reliable PDF resources, actively studying their content, and applying lessons in real-time trading environments, traders can reap practical benefits from chart patterns studies, tailored to both global markets and local conditions in Pakistan.
Applying chart patterns effectively in real trading is where strategy meets action. These patterns offer traders clear cues on when to enter or exit the market, helping to reduce guesswork. In fast-moving markets like Pakistan’s share and forex sectors, such practical tools can be the difference between profit and loss.
Chart patterns provide signals to time your market moves smartly. For example, a classic Head and Shoulders pattern often indicates a coming trend reversal. Traders might enter a short position once the price breaks below the neckline, setting a stop-loss just above the pattern’s right shoulder to limit risk. Similarly, in an Ascending Triangle, a breakout past the resistance line signals a strong entry point for going long.
Setting exit points is equally vital. If you spot a Double Top, it’s wise to prepare an exit before the price drops further. Using confirmation from volume can improve accuracy—higher volume during breakouts usually means stronger moves. Practical tip: always align these points with your risk tolerance and trading style.
Risk management should not be an afterthought when trading using chart patterns. Every pattern can fail, so protecting capital is crucial. Use stop-loss orders based on the pattern’s structure—for instance, below a support level in a bullish pattern or above resistance in bearish ones.
Position sizing also matters. If the pattern looks strong but market volatility is high, reduce your trade size to avoid heavy losses during false breakouts. Another method is to diversify trades across different sectors like the PSX textiles and energy stocks or the forex pairs USD/PKR and EUR/PKR, balancing risk.
Remember, no pattern guarantees success. Proper risk management keeps your overall portfolio steady in volatile Pakistani markets.
In the Pakistani share market, the Cup and Handle pattern has popped up recently in companies like Lucky Cement during bullish phases, signalling continuation after minor pullbacks. Traders who entered after the handle breakout enjoyed gains as prices rallied further.
Forex traders monitoring the USD/PKR pair often watch Triangles during consolidation phases. When the pair breaks out upwards from an ascending triangle, it signals strength in the dollar against the rupee—perfect for timely buying or selling decisions.
Local brokerage houses like AKD Securities and Topline Securities often release market analysis highlighting such actionable patterns, aiding traders in making informed choices. Combining these insights with disciplined risk controls helps navigate Pakistan’s often unpredictable financial markets with greater confidence.
Using chart patterns practically bridges the gap between theory and profits. Studying these patterns within the context of real local data and market behaviour sharpens your trading edge over time.
Accessing reliable PDFs and educational material is essential for mastering chart patterns effectively. In Pakistan's trading community, where practical knowledge drives success, trustworthy resources can bridge the gap between theory and real market experience. Well-curated PDFs give clear examples and diagrams, making complex patterns easier to understand and apply.
Several international and regional websites offer free and paid PDFs on chart patterns. Websites like Investopedia and BabyPips provide well-structured guides that cover basic to advanced chart analysis. For more localised content, platforms such as PSX (Pakistan Stock Exchange) website and SBP (State Bank of Pakistan) publish reports and learning material relevant to Pakistani markets. These sources often include charts reflecting Pakistan’s stock trends, lending context.
To get the most from these websites, look for PDFs updated regularly, as market practices and instruments evolve. Some platforms incorporate quizzes or interactive tools alongside the PDFs which help you test your understanding in practical terms.
Several classic and contemporary books on technical analysis are available in PDF form. "Technical Analysis of the Financial Markets" by John J. Murphy remains a top recommendation for beginners and experts alike. For more Pakistan-specific approaches, books focused on local market strategy and risk management often appear in PDF through publishers or educational institutes.
When choosing a book PDF, consider editions that feature clear pattern illustrations and examples from equity, commodity, or forex markets typical in Pakistan. Additionally, PDFs that contain practice exercises or case studies linked to PSX or forex trading help in applying the knowledge effectively.
Pakistani forums and social media trading groups can be valuable in sharing updated PDF resources and discussing pattern recognition strategies. Platforms like PakStockExchanger and local WhatsApp or Telegram groups often circulate PDFs specific to Pakistan’s trading behaviour, including tips adapted to local market moods.
Active participation in these communities allows traders to ask questions, verify interpretation of charts, and receive feedback on PDF resources they've used. They also provide alerts on newly published guides or regulatory changes impacting charting tools.
Reliable PDF resources paired with community support shorten the learning curve for traders, making pattern analysis more practical and less intimidating.
Harness these sources well to sharpen your trading skills practically and stay updated with market trends in Pakistan.
Explore Deriv Broker's platform operations, account types, and trading instruments. Learn security, regulations, and tips especially for Pakistani traders 🇵🇰📈

📊 Discover how to open and manage trade accounts in Pakistan with clear tips on types, costs, and best practices tailored for local traders.
Learn how to manage payroll effectively in Pakistan 🇵🇰 with key insights on compliance, technology, and common payroll challenges for businesses.

📈 Explore trading chart patterns with our detailed guide! Learn key types, interpretation tips & find top PDFs to boost your trading skills effectively.
Based on 10 reviews